
Ridgecrest earthquake
A local view of the Ridgecrest earthquake in July 2019 Live demo. Original application by Yann Cabon.
A local view of the Ridgecrest earthquake in July 2019 Live demo. Original application by Yann Cabon.

A classical approach to visualizing the earthquakes in the last 30 days. Live demo.

An app that maps the hills around zurich in contour lines. Live demo.

Had some fun with the Web Audio API and a BIM model...with some CSS sorcery the building starts glowing based on the microphone input stream. Have fun with the live demo.

Displays earthquakes between 2008 and 2018. The depth of the earthquake is inverted and exaggerated. See the live demo.

Taking the sketch edges to extreme: this app takes a WebScene and turns it into a hand-drawn-like scene. See the live demo.

A globe showing the population evolution from 2005 to 2020. Original data from NASA's EarthData website. See the live demo.

Had a play with visualizing emergency calls density as contour lines of a Kernel Density Surface. See the live demo.

An app displaying Berlin Palace in different styles, from realistic to abstract. See the live demo.
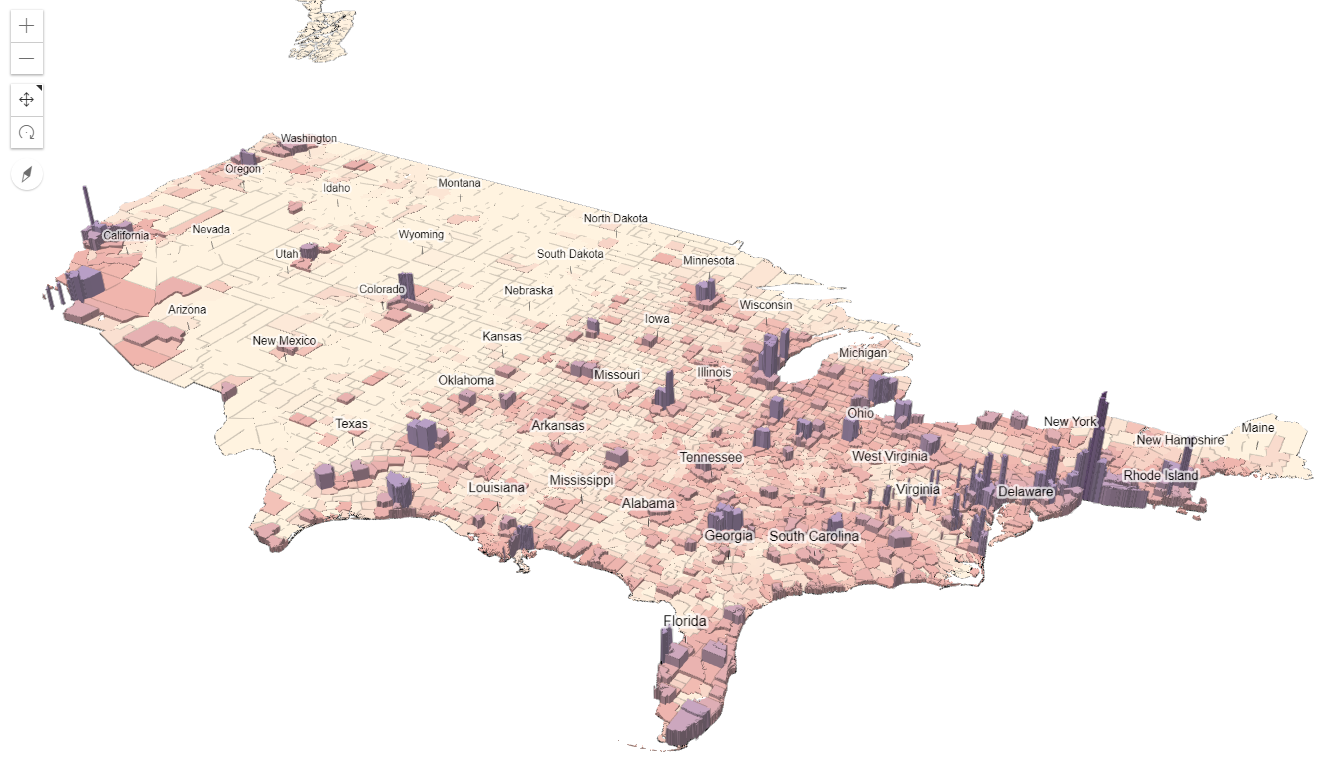
An experiment to visualize population in the USA in 3D. Population data from 2017. See the live demo. The app also shows a comparison to a 2D visualization here.

Building footprints are extruded based on the height, the color represents the construction year. See the live demo.

The app where I play with terrain exaggeration. See the live demo.
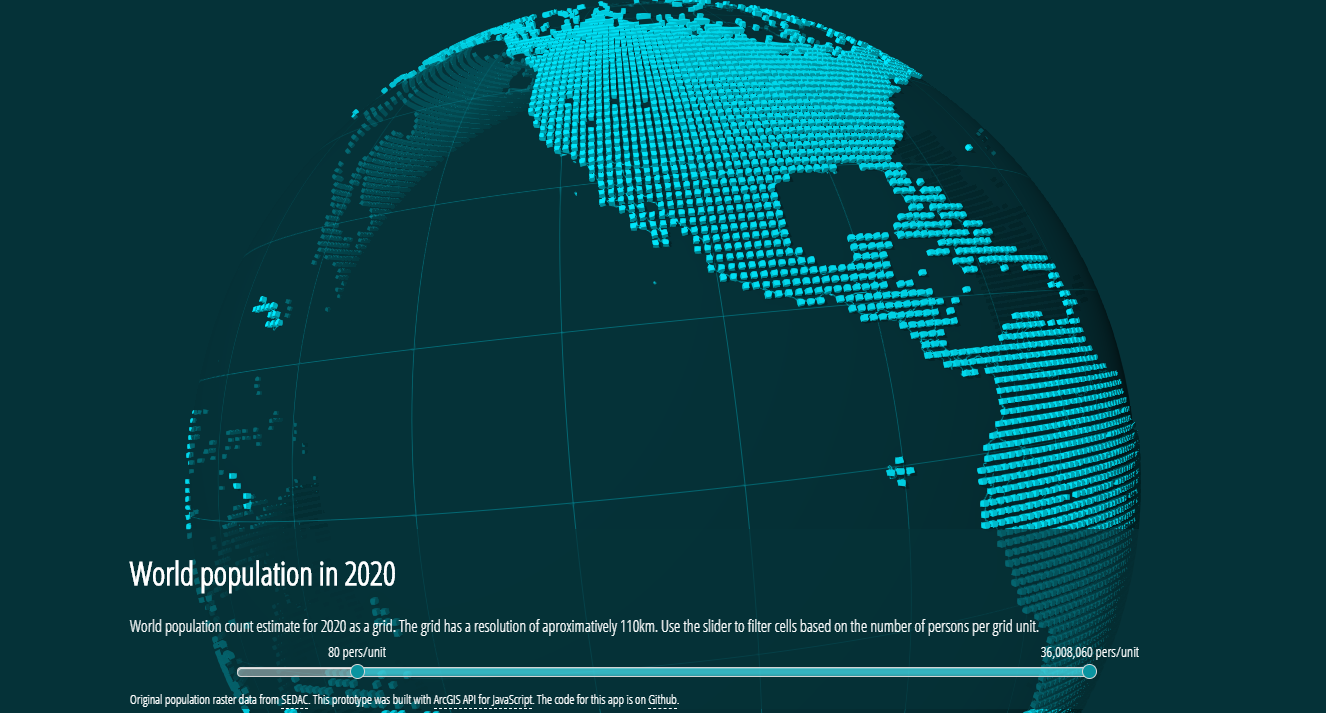
World population for the year 2020. Original data from NASA's EarthData website. See the live demo.
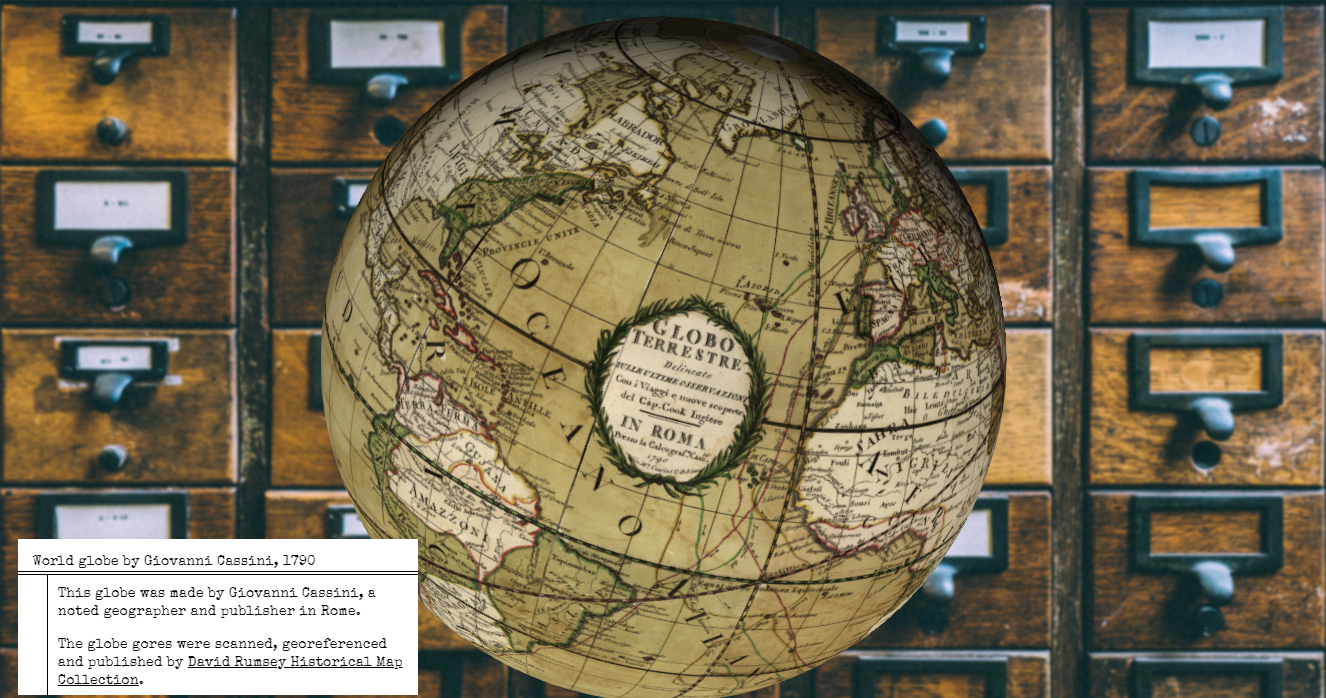
World Globe scanned, georeferenced and published by David Rumsey Map Collection. Live demo

Fun, creative project applying sketch edges to a project developed by Nik Davis and Devin Lavigne. © Houseal Lavigne Associates, LLC. Live demo

Showing current buildings and projects in development (orange buildings) in the city of Boston. Live demo
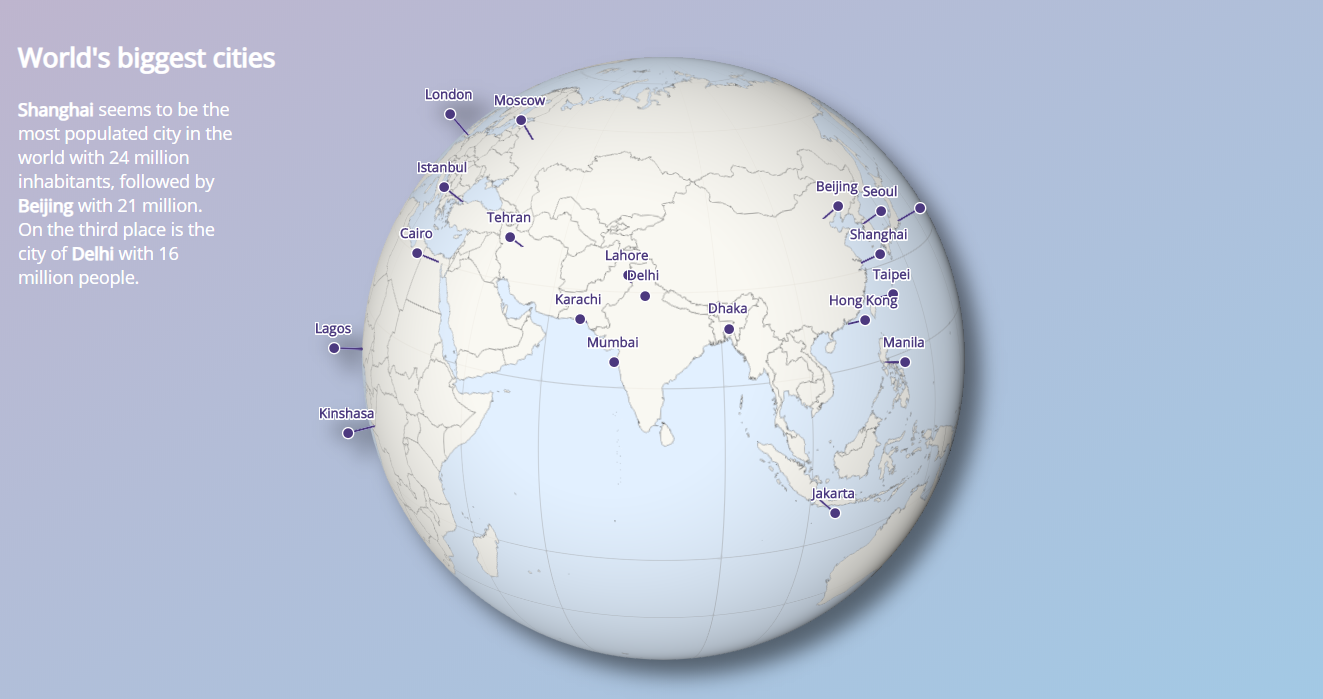
Creating a globe with the biggest cities. You can learn how to create a similar globe in this tutorial. Live demo

Distance to public transport stations in San Francisco mapped on buildings. Live demo
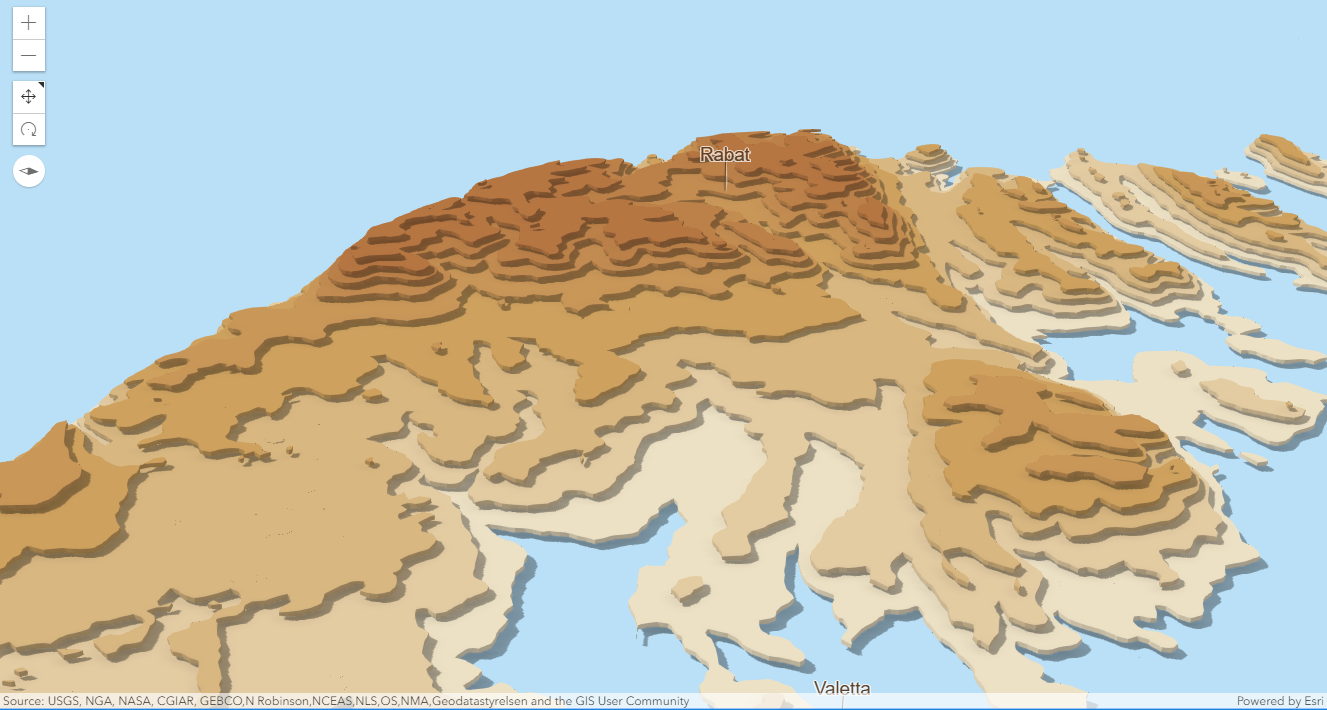
Displaying Malta's elevation only using contour lines. Live demo

I wanted to visualize my home town Bucharest in 3D, so I downloaded data from OSM like building footprints and trees and used 3D models of trees and extruded polygons as symbols. In the end, why do this only for Bucharest, when you can visualize entire Romania like this? See the live demo.

This app uses the screenshot API to take a screenshot of a webscene and apply some filters on it. See the live demo.

Yet another population map. In this one I'm setting 3D models of buildings to represent population in cities. See the live demo.

This app displays two scenes and allows user to switch between them by swiping. Live demo
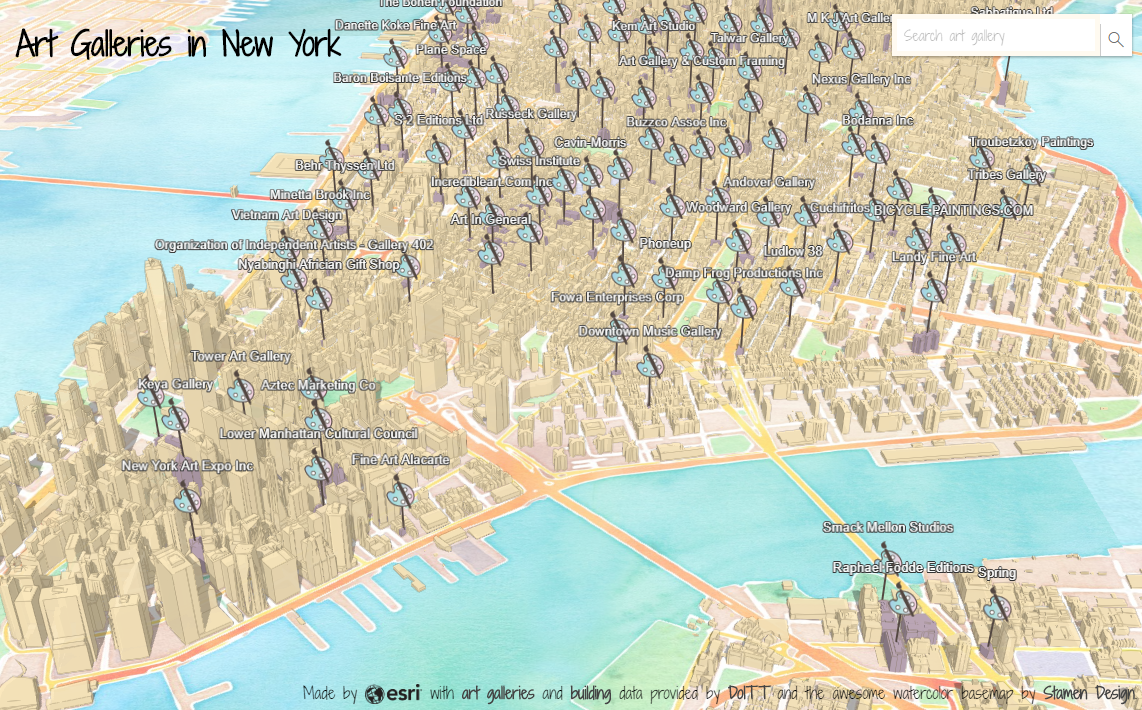
I found a dataset on art galleries in New York and thought it would be fun to map it. Go to the live demo to see what came out of it.

This app shows Christmas traditions in different countries around the world. Live demo
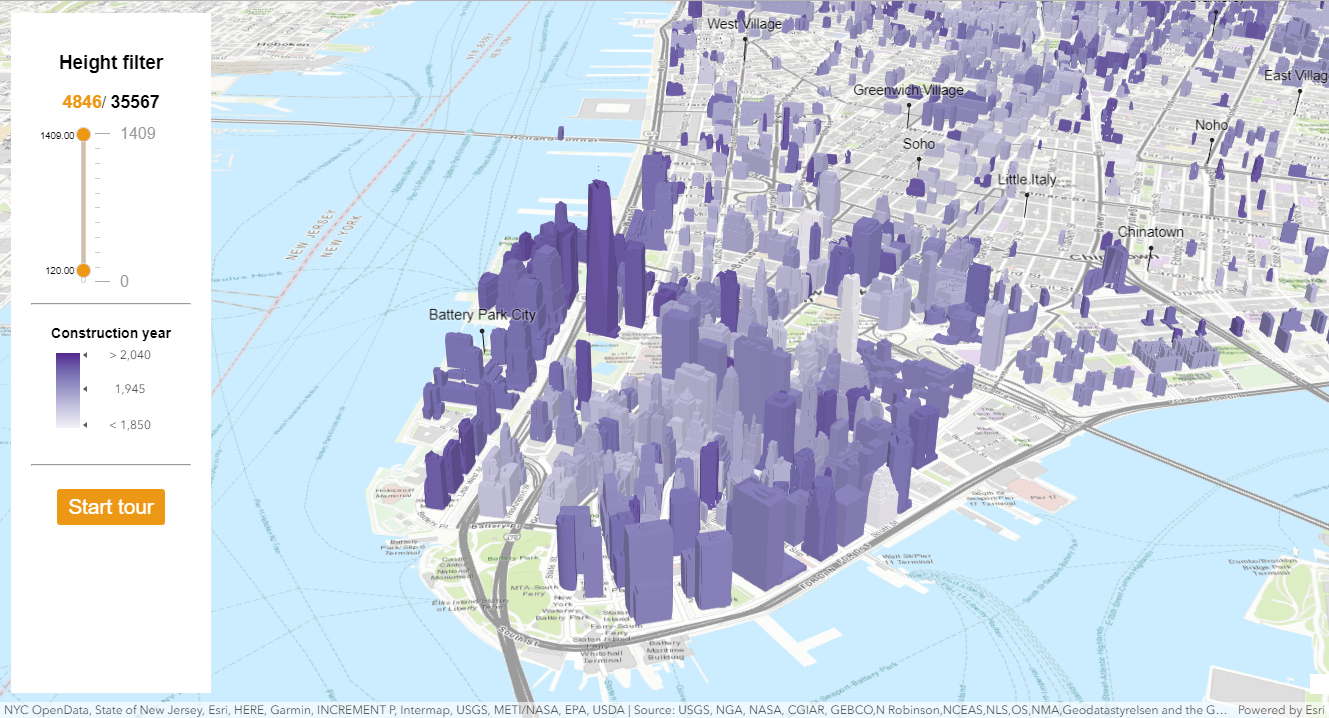
An app that I used at DevSummit 2018 to show how to filter buildings by height. It's called Indicity because you could use different indicators to filter buildings. See the live demo.